PUBLIC HEALTH IN DATA
Analysis of 107 million hospital admissions funded by SUS, Brazil's free public health system, from 2015 to 2023: volume, cost and mortality by year, diagnosis and state.
- Type
- Data analysis
- Data
- SIH/SUS, 2015–2023
- Tools
- BigQuery, SQL, Python, Power BI
- Images
- 6
Personal project with the open microdata of SUS's Hospital Information System (SIH/SUS), queried through Base dos Dados on Google BigQuery. Amounts in Brazilian reais of each year, not adjusted for inflation. The dashboard is in Portuguese.
KEY FINDINGS
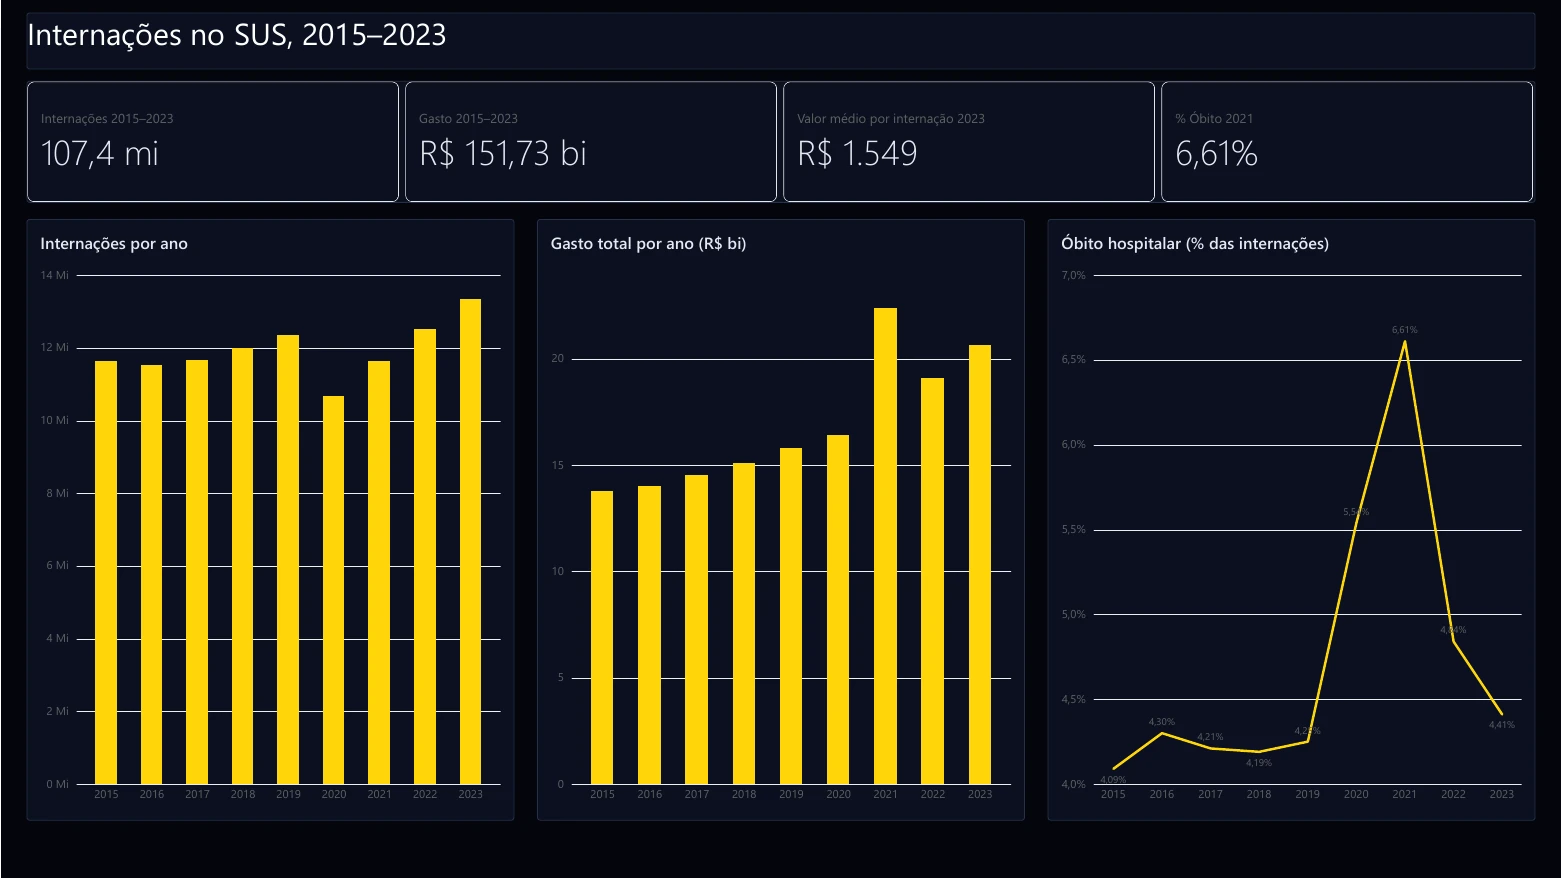
- R$ 151.7 BN
Spent on 107.4 million admissions between 2015 and 2023.
- COVID
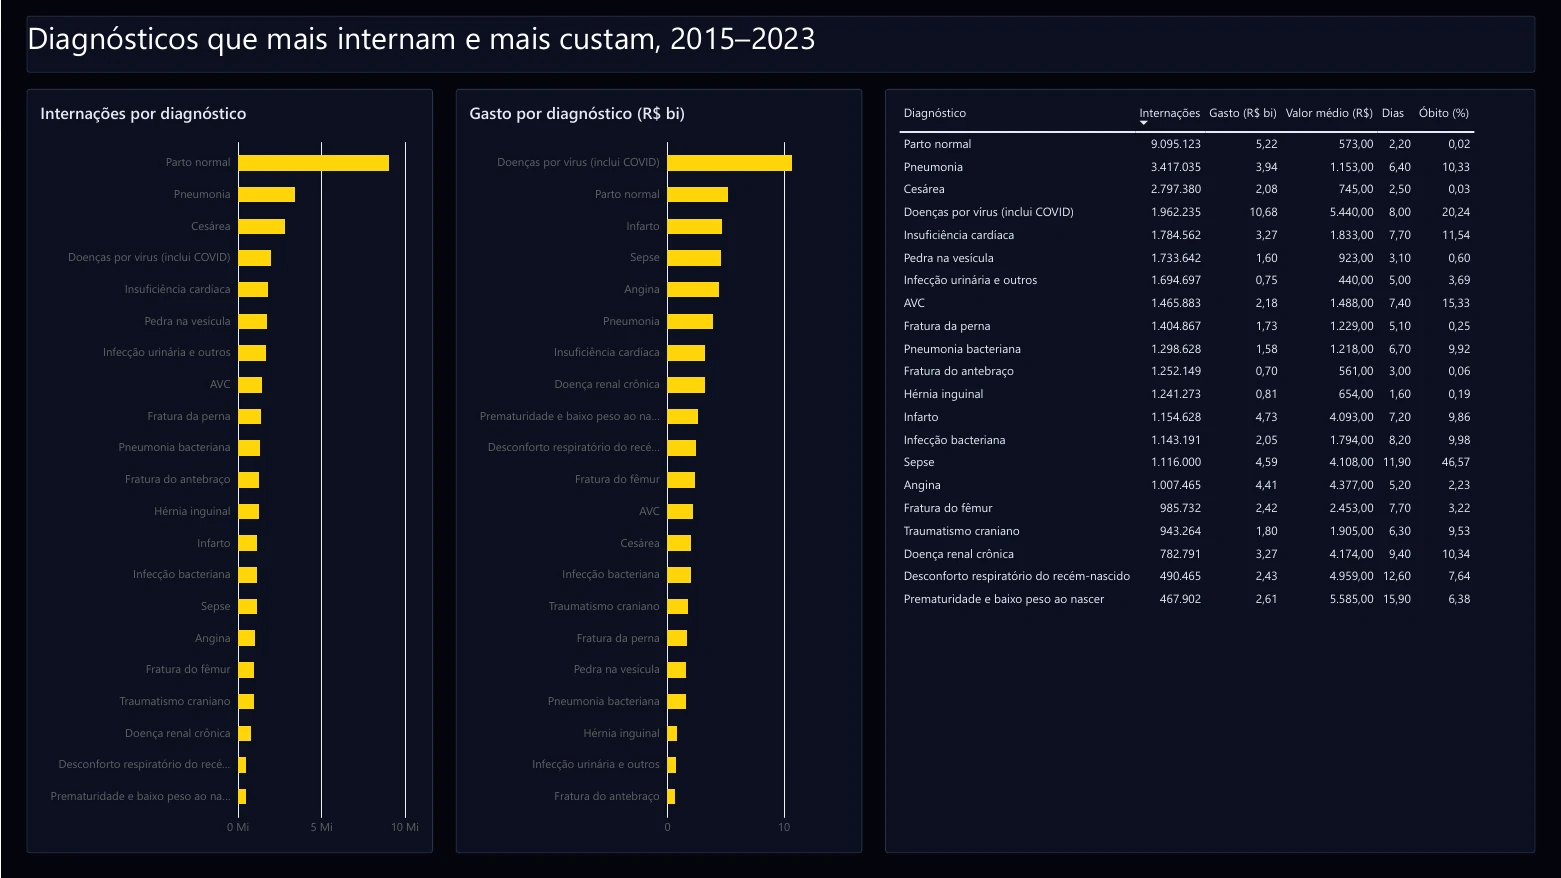
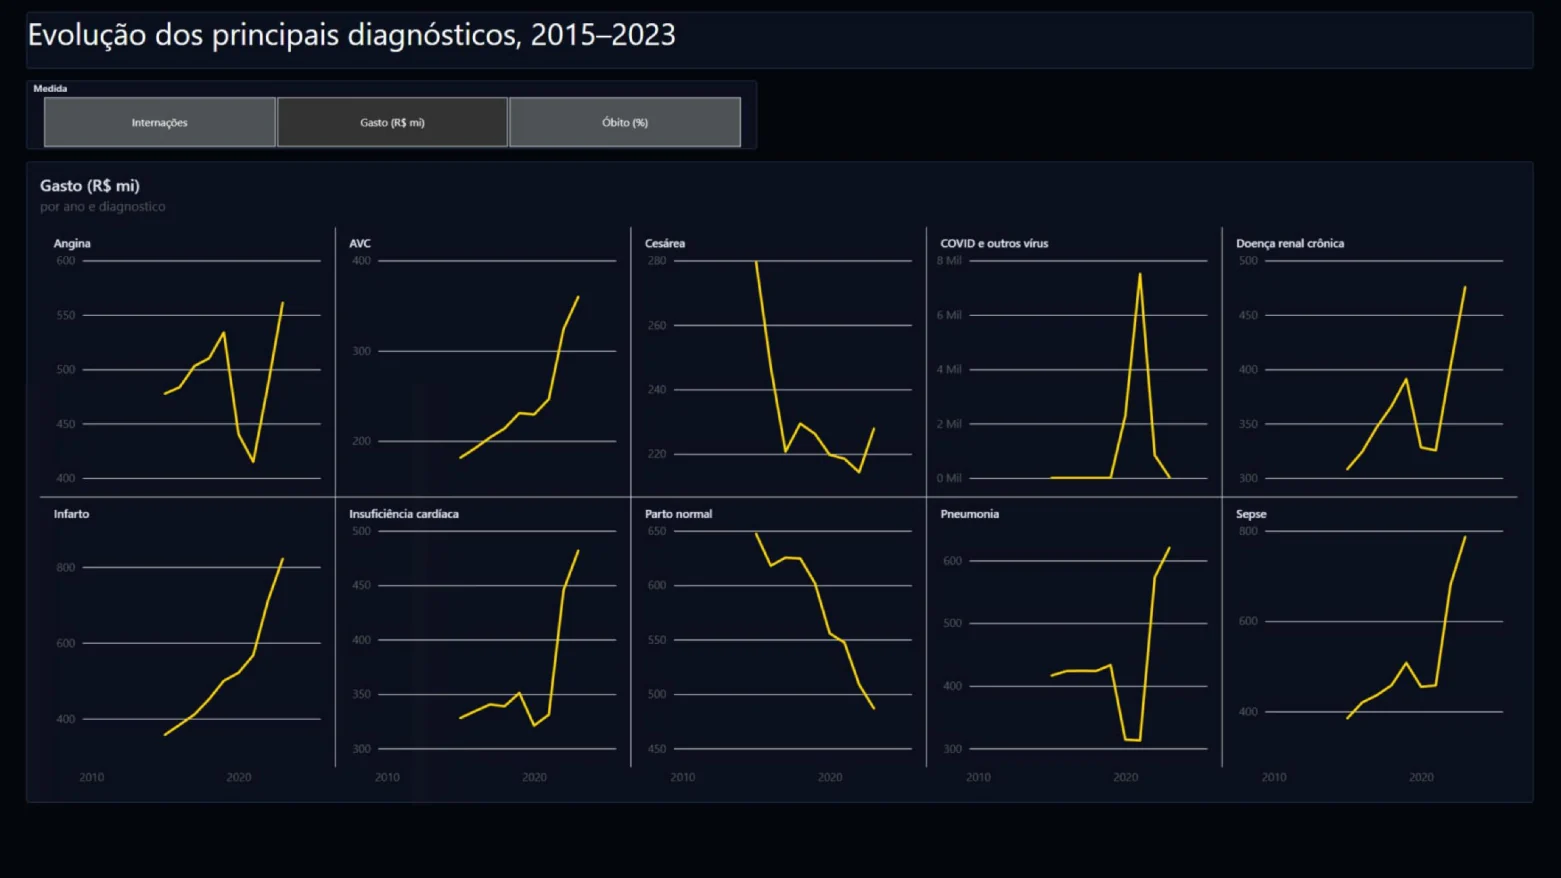
Only the 4th cause of admission by volume, but the most expensive of the period: R$ 10.7 billion. Its average cost, R$ 5,440, is almost ten times that of a normal delivery.
- PANDEMIC
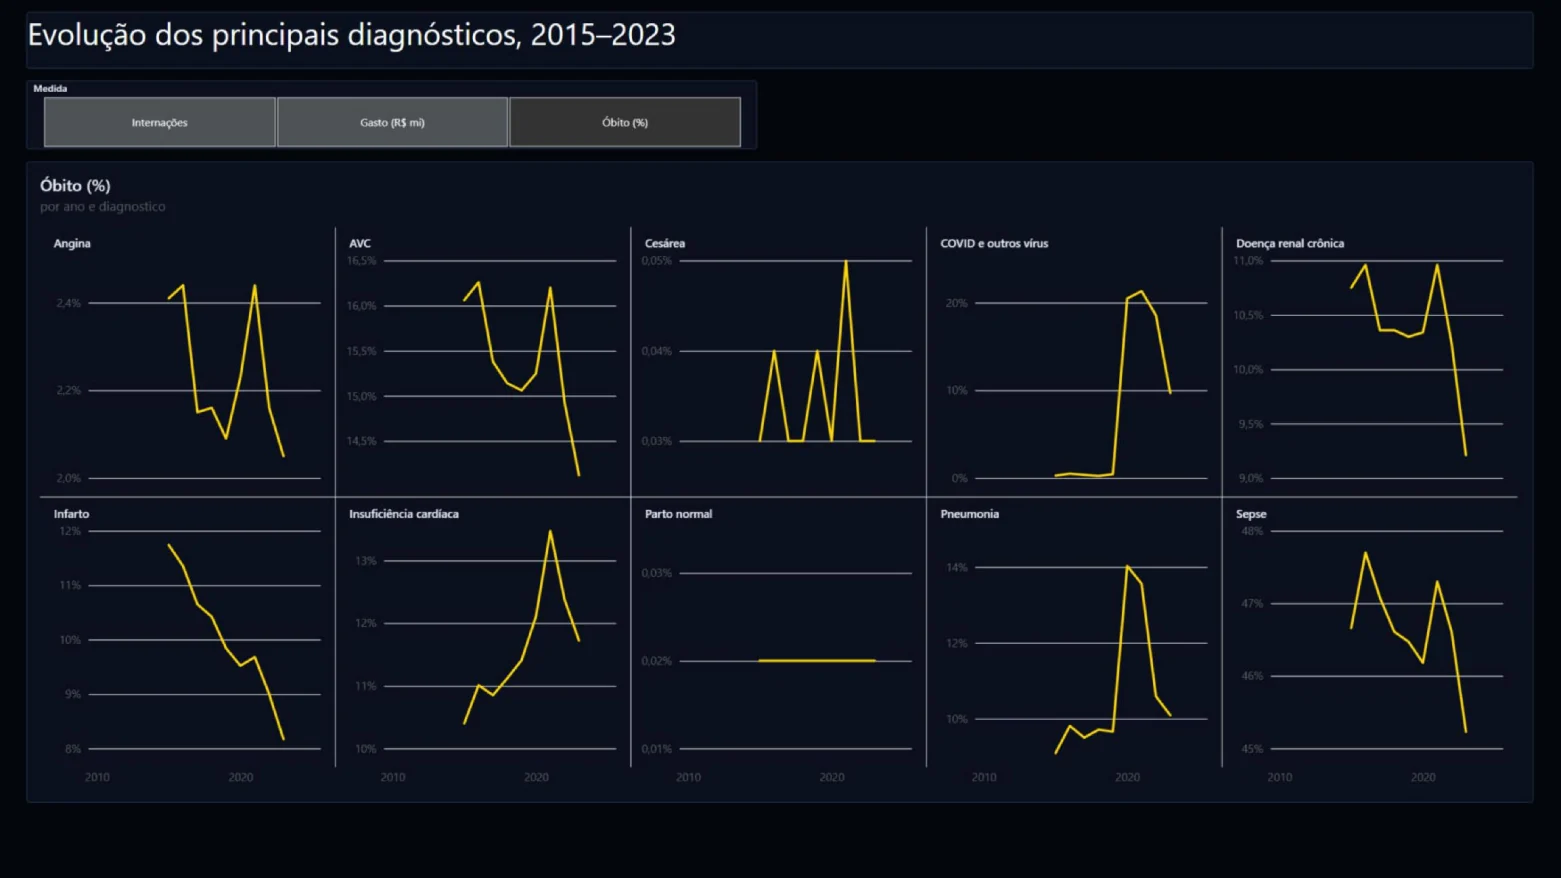
Admissions fell 13.5% in 2020 compared with 2019, and in-hospital mortality rose from 4.25% to 6.61% in 2021.
- SEPSIS
The highest mortality among the most frequent diagnoses: 46.6% of admissions end in death.
- HEART ATTACK +71%
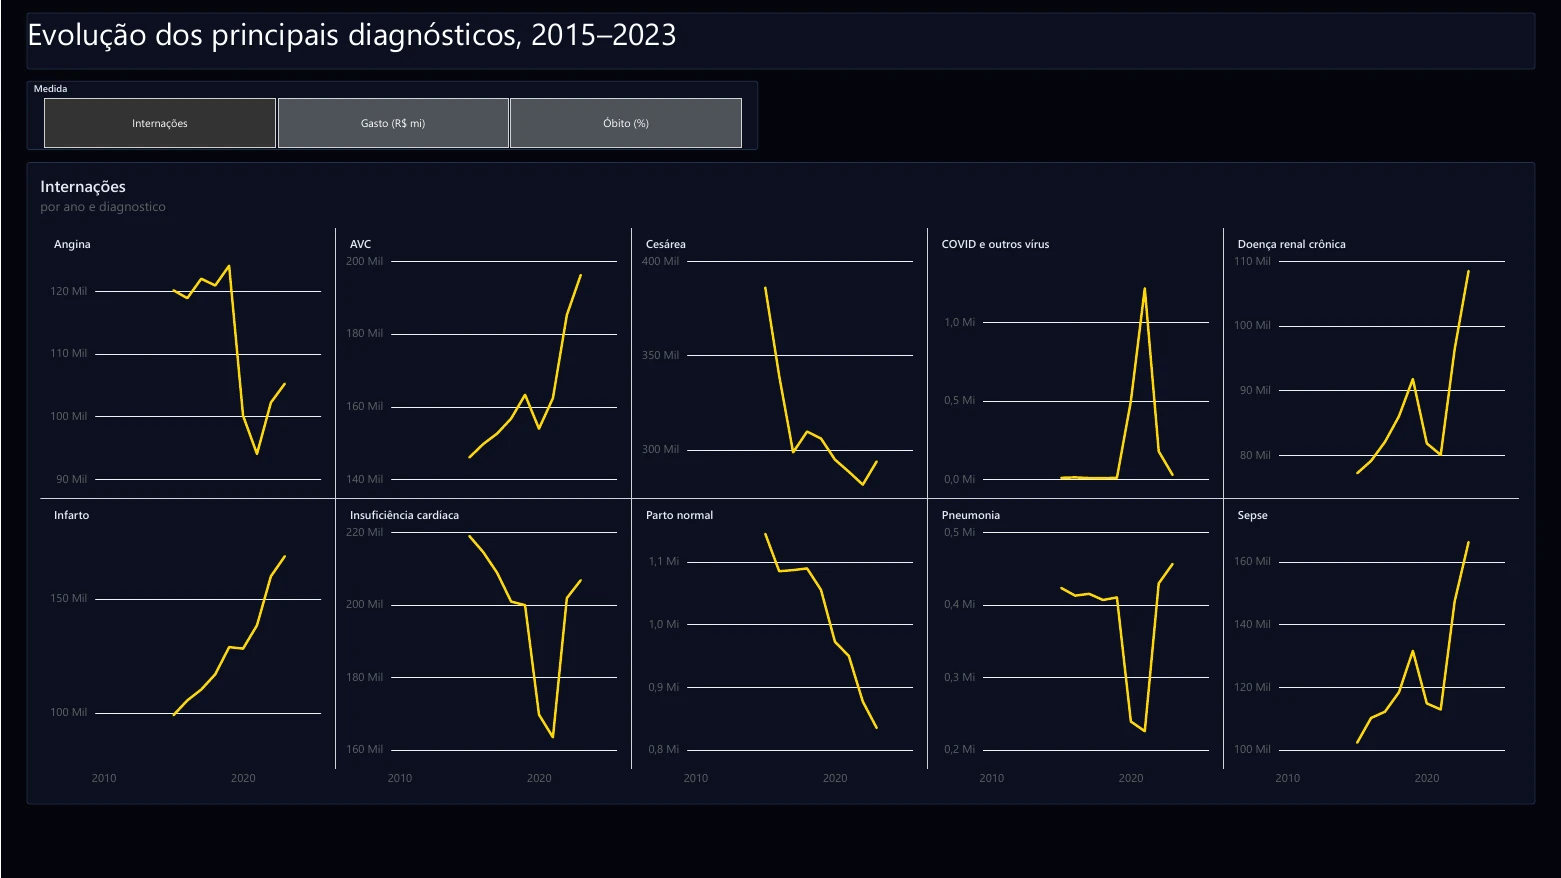
Admissions for heart attack grew 71% from 2015 to 2023, while mortality fell from 11.7% to 8.2%. Births fell 27% (normal) and 24% (C-section).
- STATES
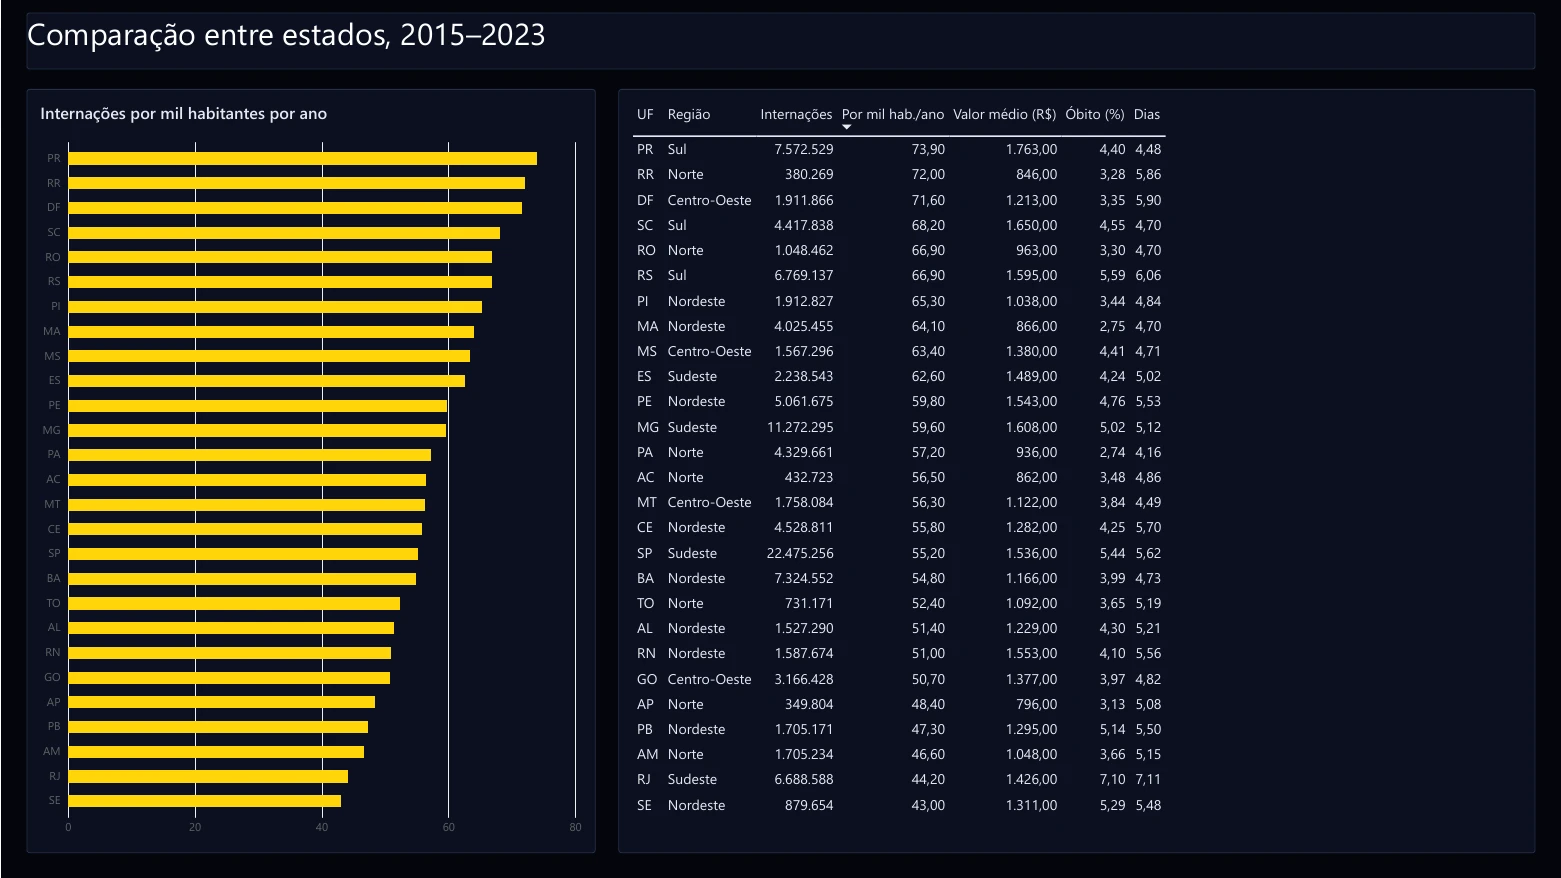
Paraná has the highest admission rate (73.9 per thousand people per year) and the highest average cost (R$ 1,763). Rio de Janeiro has the highest mortality (7.1%) and the longest stays (7.1 days).
POWER BI DASHBOARD
DATA QUALITY
- EMPTY STATE
The state column is empty in 100% of rows. The state was derived from the first two digits of the IBGE code of the hospital's municipality.
- SPLIT ICD
The main diagnosis comes in two columns, depending on the code length. Using only one, 90% of admissions would have no diagnosis, so both were combined.
- 2024 AND 2025
2024 has duplicated months and 2025 has missing months, so the analysis covers 2015–2023.
- VALIDATION
Totals by state and by year match (107,368,293 admissions in both), as do the yearly sums of each diagnosis and the overall ranking.